Transportation Infrastructure Resiliency
About
According to the U.S. Department of Transportation Federal Highway Administration, the term “resilience,” with respect to a transportation project, means a project with the ability to anticipate, prepare for, or adapt to conditions or withstand, respond to, or recover rapidly from disruptions, including the ability to:
Resist hazards or withstand impacts from weather events and natural disasters
Reduce the magnitude or duration of impacts of a disruptive weather event or natural disaster
Have absorptive capacity, adaptive capacity, and recoverability to decrease project vulnerability to weather events or other natural disasters
Incorporate natural infrastructure
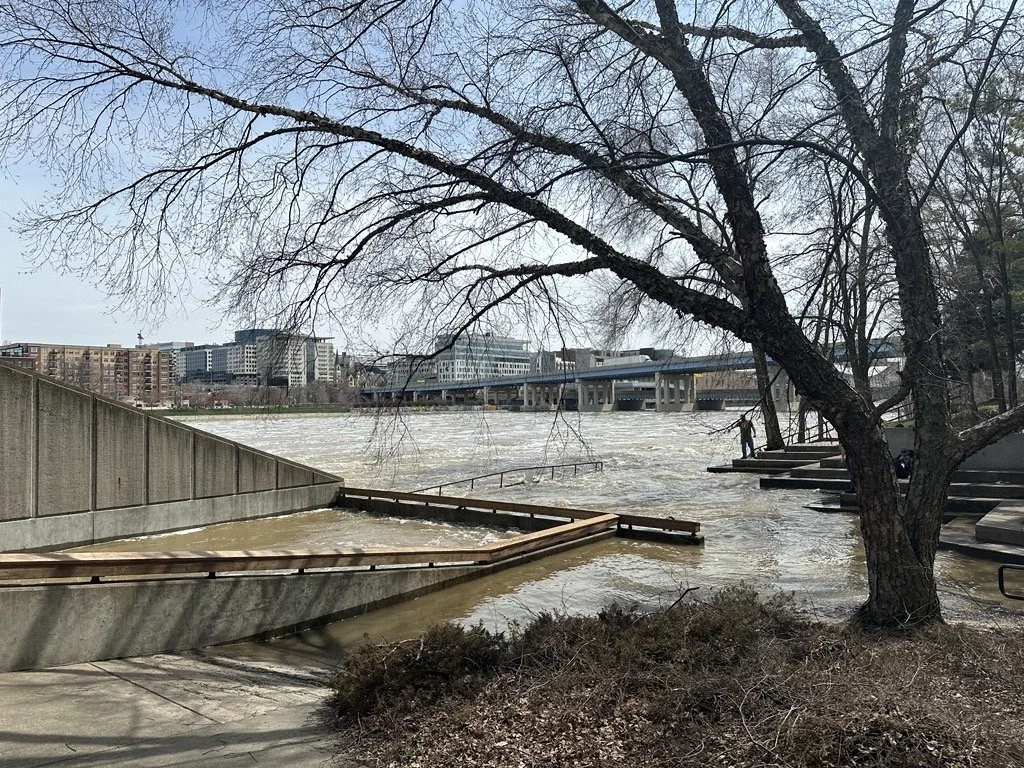
The two most prominent climate change impacts expected to affect the GVMC region in the coming years are an increase in year-round temperatures and an increase in precipitation. These changes have the potential to cause extreme heat events, heavy precipitation events, and flooding. GVMC is working to incorporate resiliency measures into our planning processes and work towards a more resilient transportation system.
Transportation Infrastructure Resiliency Study
It is increasingly important to understand the impact that climate change will have on our region to promote a safe and resilient transportation system. To do this, GVMC has completed a Transportation Infrastructure Resiliency Study with the goal of identifying how present and future climate change could impact the region’s transportation infrastructure, identify the infrastructure most at risk of being affected by these changes, and evaluate potential solutions. The outcomes of the study can help the region better understand future transportation needs related to climate change and resilience and can be used to inform plan development, project selection, and project design.
Flood and Heat Risk Viewers
GVMC staff created an online mapping tool to host the risk assessment results from the Transportation Infrastructure Resiliency Study. This tool allows the user to:
View the indicator scores of each asset
View the exposure, sensitivity, vulnerability, criticality, and risk scores for each asset and filter by each category to determine the most critical, vulnerable, or at-risk assets
Filter by jurisdiction, federal aid designation, and more to look more closely at specific assets
View the top at-risk segments by map location, such as a specific neighborhood, city, or township
View supplementary data layers that were used to inform the analyses


